
Head over to my Blogger to see a tutorial/explanation of how to solve problem #9 on Project Euler
March Madness & London
LinkHi Everyone,
Although the term March Madness was coined to refer to the intense basketball season this month, I feel it perfectly describes my hectic schedule this month.
For the first week of March, I worked on Princeton High School’s PowerSchool Android App during all of my free time, and (finally) published it to the Google Play Store (https://play.google.com/store/apps/details?id=com.ryan.phspowerschool)
Princeton High School had its Spring Break over the past two weeks and I was fortunate enough to spend that time with my family vacationing in London and Paris. During those two weeks, I decided to unwind completely so that I could relax more and absorb the European culture. I didn’t bring my laptop and only went on my phone/the Internet once every other night to read the news. London and Paris are both amazing cities and I hope I can study abroad or live in one of them during college.
Now that I’m back, I thought I would get back to posting short posts.
The British Pound is still going strong against the USD and the Euro is recovering. Britain’s economy is forecasted to pass both France’s and Germany’s economy by 2030. Britain’s service sector, comprising over 75% of its GDP, and its tourism industry, with London ranking as the 3rd most visited city in the world, are both expected to grow within the upcoming years.
The British Government’s economic austerity plan, which aims to cut government debt by reducing government spending, is finally working. An austere economic plan is one that reduces the number of services and goods provided by the government in the hope that private corporations will expand to cover that reduced number of goods and services. Having consistently been one of the slowest growing economies in Europe over the past post-depression years, England’s economy is finally growing by roughly 2.5%, and is expected to continue growing in that range for the next few years. It’s not only the British government’s austere economic plan that is contributing to Britain’s growth; it’s also Britain’s quantitive easing program. Although an austere plan involves reducing government spending, the Bank of England has decided it is best to spend (the saved money?) on a Euro 375 billion bond-buy-back aggressive quantitive easing program to keep interest rates low. The Bank of England’s Quantitive Easing Program is similar to the US’s Federal Reserve QE Program in that they both involve the country’s central bank purchasing large amounts of bonds monthly to keep interest rates low and make bond purchases unattractive to investors, who should then (hopefully) invest in stocks and companies. Unlike the US’s Federal Reserve, the Bank of England stated that they will continue the aggressive QE program to keep interest rates near 0.5% well into 2015, while the Federal Reserve has already begun decreasing the amount of bonds it is buying back. Both the Bank of England and the Federal Reserve’s QE Programs are working; both economies are growing positively in the 2% range, consumer confidence is increasing, manufacturing & construction sectors are growing, and unemployment is decreasing.
Although I haven’t gotten into FX/Currency Trading yet, I would go long on the British pound. I would also invest in companies trading on the London Stock Exchange. Britain’s economy started off the recovery process slow, but I can only imagine that it will begin to pick up, especially as the Bank of England announced they would continue purchasing hundreds of billions in bonds to reduce the interest rate. In terms of historical precedence, most recently/currently with the US, quantitive easing programs that aim to reduce interest rates in order to increase investments in companies through the stock exchange, has only helped that country’s economy to grow and their stock market indices to rise.
Post-Exam Economic Analysis
StandardHi Everyone, Sorry for my delay in posting. I had to deal with midterms last week. I’ve also been busy working on a PowerSchool app that I plan to publish next week.
On January 6th, I wrote a post analyzing Starbucks. I was correct in that Starbucks failed to beat most of Wall Street’s estimates and its stock took a dive to $68, about 12.5% below the price which I sold it at and 18% lower than its all time high. It’s at $70.57 today, which is more than $12 below its high. I made a good call in saying that it’s time to sell SBUX.
Starbucks wasn’t the only company to not beat earnings. In fact, the entire economy seemed to have sunk a bit over the past couple of weeks. The DJIA dropped 200 hundred points in a single trading session and the S&P 500 posting one of its biggest 2-day slides in the past year. Economists have blamed disappointing manufacturing data from China and US earnings.
On top of that, unusual weather patterns have been negatively effecting the globe. Extreme storms pounding America have caused entire regions of the country to shut down for days. Not only is that causing tens of millions of Americans to be unable to go to work, but also millions of businesses to shut down and billions of dollars to not be spent. Outside of America, Brazil has been hit hard with a draught estimated to cause nearly 30% of its coffee crops to die. If Brazil, the world’s largest exporter of coffee beans, loses nearly a third of its export, coffee bean prices around the world will rise, negatively affecting consumer spending.
Emerging Markets: I found this interesting observation Paul Krugman published a couple of weeks ago about emerging markets. He described that most economists were debating if we faced secular stagnation. Secular stagnation is a situation in which the amount people want to save exceeds the volume of investments worth making. If we are facing secular stagnation, investors disappointed by low returns would pour money into emerging markets, which is what most investors are doing now. Krugman believes this would boost the economy for a while, but investors would eventually realize that it was an ill-conceived investment and the money would dry up. This entire process would involve bubbles followed by recessions, not an encouraging thought as it looks like the emerging market’s current bubble looks like it’s going to pop.
That’s all I have right now. I’ll try to write a bit more over the upcoming days/weeks.
First Post (Computer Science Section)… About Me
StandardHi!
My name is Ryan D’souza and I am currently a Junior at Princeton High School, Princeton NJ.
I’m primarily interested in Computer Science, Economics, and Finance with a focus in the financial computing area, where the three disciplines intersect.
Computer Science:
Some of my favorite childhood memories involve me showing my family, namely my parents, how to use new technology (ie. cameras). It made me feel like a genius. I was mainly interested in the software part of technology; I was more interested in playing around with the settings to make it do what I wanted it to do then taking apart the camera, although I did love building things with legos.
When my family got an HP Compaq when I was in 6th grade, I used to hog it all the time, not necessarily for work, but to explore.
After a couple of years, my family upgraded to the 15″ 2009 Mac Book Pro, after I spent hours convincing/persuading them to choose (Mac) OS over Windows.
That too, I continued to hog, even getting up an hour or two before I was supposed to wake up, to browse and play around on the computer. At this point, I was still teaching new technology to my parents and explaining how to do tasks to both teachers and friends at school.
In 8th grade Industrial Arts, one of our projects was to build a Lego robot, attach sensors, and program it to finish an obstacle course without touching the obstacles by using the sensors. The programming itself was very basic, we basically had to draw out what we wanted to do by placing pictures of the robot’s parts in a line (right engine connected by a line to front sensor connected by a line to the brake). Although it was very easy ‘programming’ it was all that I knew, so I always came in during lunch and recess to ‘program’ the robot.
That brings me to my Freshman year at Princeton High School. Although I didn’t get into the Computer Science classes that I wanted because of scheduling conflicts, I began learning HTML by myself using W3 Schools. My High School Computer Science teacher organized a program with the neighboring Princeton University Computer Science Undergraduate students to come to the high school and teach us programming (Java). I attended those after school sessions at the high school, practiced everything at the school, and then came home and practiced it again on my home laptop, showing my parents everything.
That 9th grade summer, I took a Java with Business Applications course at Mercer College. I got my first programming textbook and had my first programming course, and I was hooked. Even though the students in my class frequented the answer key because of laziness, I always attempted and finished the program myself before seeing how the book’s authors did it. Shortly there after I began learning AppleScript and wrote a couple apps, including a time-saving script that would open a Word Document, type my name, the current date, assignment title, and class, bold all of it, and save it with the assignment title in its respective class folder in Dropbox.
In 10th grade, I was put into Accelerated Java because of scheduling conflicts. Although I was upset I had to program with ‘noobs’ I continued to delve further into Java, mainly GUIs. By the end of the year, I developed a small Java app with a GUI that parsed the Internet for the current stock price of a stock, downloaded the CSV chart from Yahoo Finance, and graphed the last 5 days prices. I also learned how to use Advanced Excel functions, like Macros & VBA. I helped my friend Adrian Hertel with our Princeton Tiger Tech Community Service Group, in which we fixed iPhones, Droid phones, and all kinds of laptops, free of service charge. We also installed software and gave tutorials to those in need.
Over the summer, I dabbled with C++ and JavaScript before ultimately deciding to stick with Java and learn Android programming. I began converting my stock price graphing Java GUI into an Android app, but slowed down my work in the beginning of the school year because I joined the robotics club and Ultimate Frisbee club. When it began to get to cold to play frisbee outside, my friends and I created a Computer Programming Competition team to compete in solving problems at Computer Science competitions, namely the PClassic, hosted by the University of Pennsylvania’s Dining Philosophers. Since then, I’ve started three other Android projects: a PowerSchool client, an Alarm Clock app, and a secret one that I’ve partially built but am waiting to rebuild it at a hack-a-thon.
Adrian Hertel got me Robert Sedgewick and Kevin Wayne’s Algorithms Book in Java, the textbook used in Princeton University’s Algorithms 1 class. I plan to post some code/algorithms from that book here.
On this site, I also plan to post solutions and explanations to Computer Science Competitions and snippets of code/algorithms I learned.
I’m still using my 15″ 2009 MacbookPro although I’ve maxed out the RAM (8GB) and got a 500GB Solid State Drive.
2014 Predictions
StandardI ended off last year saying that I predicted a stock market crash followed by a short economic recession at the beginning of 2014. So far, I was kind of right.


The year began with the Federal Reserve announcing that it would begin tapering off it’s Quantitative Easing Program from $85 billion in monthly US Treasuries/Bonds purchases to $65 billion, as previously predicted. The first three trading sessions (days) of the New Year were red, with the DJI losing hundreds, as also previously predicted. Now, in the middle of January, the stock market is still going down because a lot of companies are missing Earning’s estimates, also previously predicted. Citi bank missed earnings and bank mammoths JP Morgan and Goldman Sachs announced bleak futures.
Let’s analyze this note written by Goldman Equity Strategist David Kostin
The current valuation of the S&P 500 is lofty by almost any measure, both for the aggregate market as well as the median stock: (1) The P/E ratio; (2) the current P/E expansion cycle; (3) EV/Sales; (4) EV/EBITDA; (5) Free Cash Flow yield; (6) Price/Book as well as the ROE and P/B relationship; and compared with the levels of (6) inflation; (7) nominal 10-year Treasury yields; and (8) real interest rates. Furthermore, the cyclically-adjusted P/E ratio suggests the S&P 500 is currently 30% overvalued in terms of (9) Operating EPS and (10) about 45% overvalued using As Reported earnings.
Reflecting on our recent client visits and conversations, the biggest surprise is how many investors expect the forward P/E multiple to expand to 17x or 18x. For some reason, many market participants believe the P/E multiple has a long-term average of 15x and therefore expansion to 17-18x seems reasonable. But the common perception is wrong. The forward P/E ratio for the S&P 500 during the past 5-year, 10-year, and 35- year periods has averaged 13.2x, 14.1x, and 13.0x, respectively. At 15.9x, the current aggregate forward P/E multiple is high by historical standards.
Most investors are surprised to learn that since 1976 the S&P 500 P/E multiple has only exceeded 17x during the 1997-2000 Tech Bubble and a brief four-month period in 2003-04. Other than those two episodes, the US stock market has never traded at a P/E of 17x or above
P/E: Price to Earnings Ratio –> Share Price / Earnings Per Share. In the context of this note, Kostin is saying that many investors are expecting P/E ratios to grow to 17 – 18 X the current Earnings Per Share, which is very large considering that the ratio for the S&P 500 during the past 5, 10, and 15 year periods has never averaged higher then 14.5%. In fact, the long–term average is supposed to be of 15%.
Bottom line: Kostin believes that investors have over estimated the growth of the share price which makes them believe the P/E ratio will be 17 – 18X the EPS instead of the current 14X.
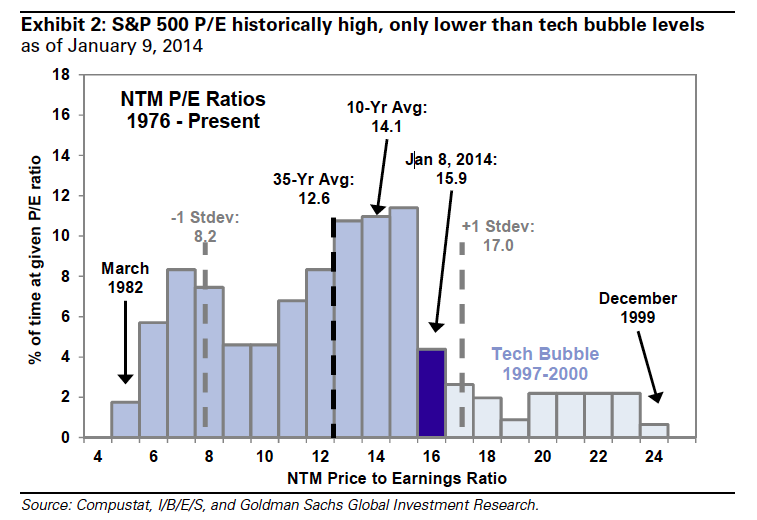
This chart depicts that the P/E ratios have only been this high in the great recession.
The Current P/E Expansion Cycle Kostin mentions is the economic cycle the P/E goes through during one business cycle (expands then contracts).
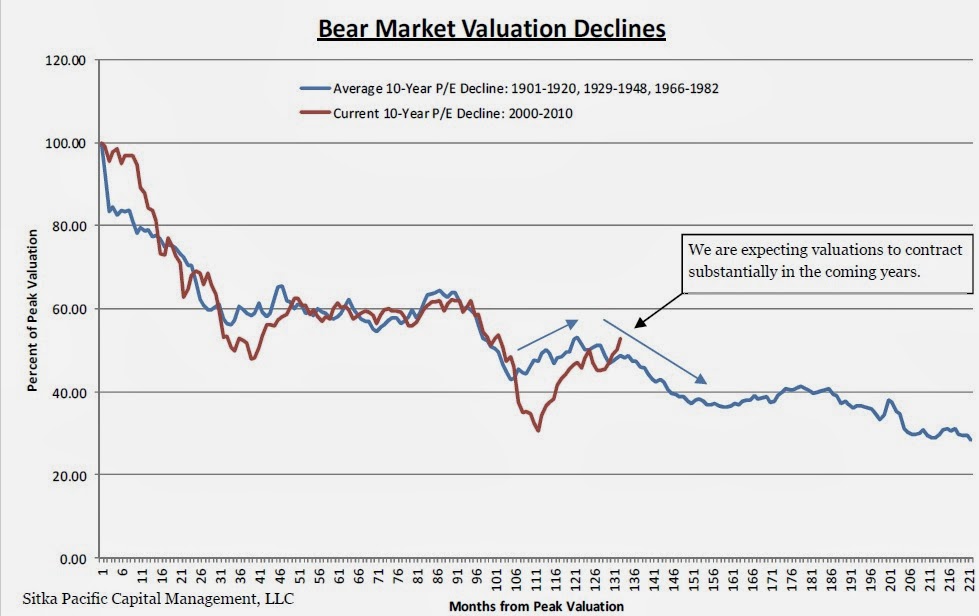
Like this Bear Market Valuation chart from Sitka Pacific Management shows, we should be expecting earnings valuations to contract. The chart shows the average 10 year P/E decline (approximately a cycle, in blue) with the current 10 year P/E decline in red.
EV/Sales: Enterprise Value to Sales –> Ratio that compares the total value of the company (includes debt and cash) divided by the amount in annual sales. Essentially the total value of the company that is made for every $1 of the company’s revenue.
EV/EBITDA: Enterprise Value to Earnings before Interest, Taxes, Depreciation, and Amortization. Another indicator of the value of the company.
SBUX (Starbucks) Analysis
StandardHi All,


Happy New Year! One of my New Year’s resolutions was to update/post to this blog more often. Lately, I’ve been busy with many different things. I started a program competition team in my school, so those practices have been taking up a lot of my time. I’m also working on another Android app, which is actually a secret, and my deadline for publishing is the second week of January. Lastly, my friend and I are working on an app/idea for the Verizon App Innovative Challenge.
Outside of programming, I finished my Eagle Scout Project, and now have to do the write up.
Another one of my other New Year’s resolutions was to read an investing book every quarter, starting off with Benjamin Graham’s Intelligent Investor.
In the realm of business, I’ve become addicted to SeekingAlpha, and am reading 20+ articles a day (a lot, considering some are very long). I still read Business Insider, WSJ, the Economist, and Financial Times.
Starbucks
Disclaimer: I used to own shares in SBUX and do not plan on buying more shares within 72 hours of this article. I’m also a Starbucks Gold Member and am currently writing this at Starbucks.
Starbucks was one of the first companies I ever invested in, and it is currently the stock I have made the most profit from. We have a Starbucks in Princeton, and I love it; I visit it twice a month for hours at a time. The atmosphere is great for work, there’s an abundant source of caffeine, and I get to interact with Princeton University students.
I actually bought the stock about a year and a half ago after I saw how the store was perpetually filled with people, and how it had solid financials that indicated constant growth. I bought seven shares at $45.
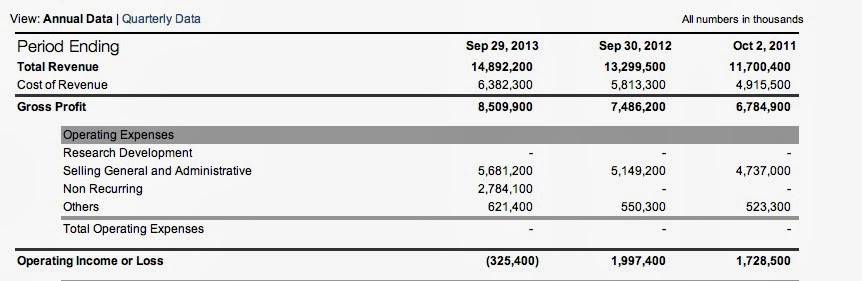
I sold it at the end of last month when it reached a height of $80 (November). During the year and a half of investment, Howard Schultz, CEO of Starbucks, expanded the number of stores both domestically and internationally, increased revenue by $1.6 billion, increased profit by $1.1 billion, and decreased Operating Income/Losses by $1.6 billion.
That’s when I decided to sell the stock. At first I was reluctant; it is an investor’s nature to want to hold onto something that is constantly giving them profit. But after two months of a stagnant price, it appeared Starbucks was at a Resistance Level.
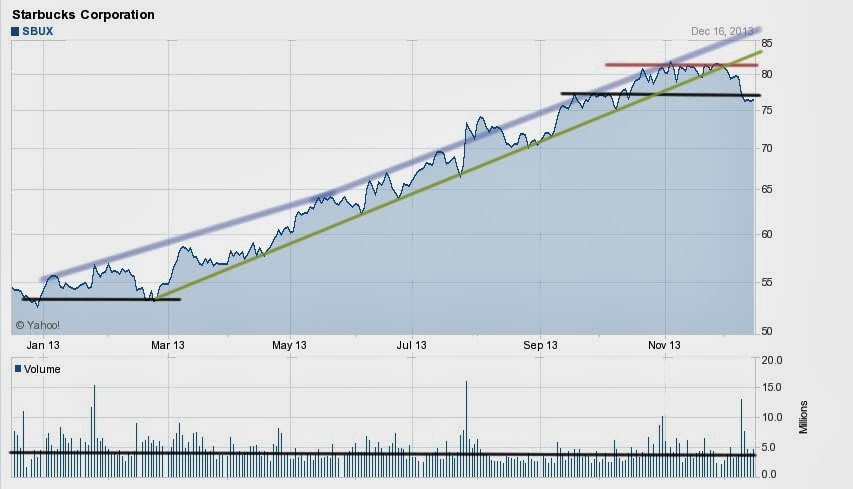
In this crude drawing of Starbuck’s stock prices for the past 12 months, I try to identify six different things.
- The first is a support level at $53 from Jan 13th 2013 to March 13th 2013.
- I then draw a best fit linear line (in green) which touches the lows from March 13th 2013 to November 20th 2013. As depicted, the price did not drop below that line during the time. I drew that line to try to lineate or find the best fit line for the stock growth.
- There are two blue best fit lines that each show Starbuck’s high prices for six months.
- The black line from September 15th to the present depicts a possible support level at $77.
- The shorter red line from September 20th to November 15th portrays a resistance level at $82.
- I also drew a line on the chart at the bottom of the page which serves as a basis for volume comparison over time. From Jan 13th to November 13th, the average volume is above that line at 4.8 million. Since then, the stock’s volume went above 4.8 million was when the stock price dropped, which shows investors aren’t lining up to buy like they were from Jan to November.
Primarily shown by the green best fit line is how Starbucks stock price should be at least $10 higher (~12.50%) then it is right now. From a chartist/technical view point, this stock has slowed down in growth, as its stock price is below the lowest point it should be based upon a best fit line that outlines the lowest prices for the stock.
The two blue best fit lines for Starbuck’s high points show that Starbucks stock price should be $15 higher then it currently is.
EDIT: The above chart was taken in mid December of 2013. Today is Jan 6th and SBUX is still at $75 range, which shows how it is underperforming.
Revenue: Increased 13% to $3.8 billion
EPS: Increased 37% to $0.63 per share
Growth: Global store sales grew by 7% with 5% increase in traffic (8% growth in Americas and Asia Pacific)
Stores: 558 new stores this quarter
Fiscal Year 2013 Highlights
Net Revenues: Increased 12% to $14.9 billion
Operating Income: Increased 23% to $2.5 billion
EPS: Increased 26% to $2.26 per share
Stores: Opened 1701 new stores, total of 19,767 stores globally
I didn’t just throw all those numbers out there to show that I can do research; I put them out there to show Starbuck’s unsustainable growth levels. For Starbuck’s to beat estimated revenue growth of 13%, it would need to earn $4.294 billion in the next Fiscal Year. That’s 4 X more then Buffalo Wild Wing (BWLD), Papa John’s (PZZA), Dominoes Pizza (DPZ), and Chipoltle (CMG) earn in revenue per year.
Aside from unsustainable growth levels, Starbuck’s stock price is also becoming very expensive. Investors buy stocks in hope that the company grows and then other investors buy stocks, increasing the price. But, the more expensive the stock is, the lower the number of shares an investor can buy. And with high share prices comes smaller percentage increases which detracts/de-incentivizes investors.
Bottom Line: Starbucks has grown phenomenally over the past few quarters, but it has reached a point where it will no longer be able to sustain it’s growth and will miss earning’s estimates.
What I See For Christmas
StandardHi Everyone,


Sorry for the delay in posting. I had spent three to four hours writing this post two weeks ago, but I accidentally deleted it from Blogger. I’m rewriting it from memory as there is no trace of the post; it’s not in Google Cache or accessible through recent links. I now vow to always export my work to my solid state drive.
I had a programming competition last Saturday, so all my free time went to training. I’m also debating about making a Computer Science blog where I’d post my solutions to online programming problems. My code will be better commented and more readable then the other solutions posted online.
Bear Case:
In my original post, I had described a red and black Christmas this year, and I wasn’t foreshadowing my Christmas presents (I haven’t been that naughty). I was talking about companies’ earnings reports. I had come to that dismal conclusion from observing interest rate trends, unemployment rate numbers, reading reports about the FOMC, and trying to predict the role the Federal Government shut down would have on consumer spending.
Interest Rates: Federal Reserve Chairman Ben Bernanke enacted the agressive Quantitive Easing program a couple years ago to encourage consumer and business spending. Bernanke’s plan called for the US Federal Reserve’s purchase of $85 billion in US Bonds and Treasuries per month in order to keep interest rates low. Low interest rates encourage consumers to borrow to spend money and invest in businesses, and allows businesses to take loans to hire more workers and invest in other businesses. The interest rates, currently between 0% and 0.25%, have caused consumer and business spending to be at all time highs.
Consumers are spending more causing companies to get more revenue, and beat analyst opinions in their earnings estimates. This has caused stock prices to reach all time highs; beating estimates shows the company is profitable. As soon as the QE program declines/ends, the interest rates go up, spending comes down, and earnings go down with it. In a recent blog post, I also mentioned that Investor Credit/Margin trading (borrowing money to invest in stocks) was at an all time high.
The low interest rates have caused consumers to spend more money, causing businesses to post increases in revenue. The attractiveness of business growth invited consumers to invest money in a company through the stock market. As more people continue to invest, stock market prices increase. People realize the stock market is profitable, and borrow money so they can invest in the expensive stocks, jumping on the profit bandwagon.
When interest rates increase, it becomes more expensive for consumers to borrow money to invest in stocks. This will cause them to sell of their investments, so that the increased interest rate doesn’t kill their profits. Selling stocks will decrease stock prices, and cause other investors to sell their stocks.
The chart above shows that large investor debt/credit foreshadows a stock market crash. Borrowing (red) increases when stock prices (blue) increase. When the market begins to go down, borrowers rush to sell their holdings, as shown by the positive credit (green) that occurs right after a stock market crash.
Dismal Earnings Season: The US Federal Government shut down for 16 days in the beginning of October because a new budget for the October 2013 – October 2014 Fiscal Year had not been passed by Congress. The 2 Million + Federal Government employees went without pay and the Federal Government went for two weeks without spending any money (except for essentials like Food Stamps). In total, this was expected to cause the GDP to decrease by 0.7%. I also expected consumers to save their money in anticipation of the Government going over the National Debt Ceiling. With a government that spends $60 billion daily and only collects $30 billion daily, it is no surprise that we’re reaching the new debt ceiling that Congress raised two years ago. If the US hits the debt ceiling, it will default on some of its payments ($30 billion to spend daily), either interest/yields on bonds, or government programs like Social Security and Benefits. Defaulting on the bond yields would cause the US debt rating to be increased, and cause investors to lose trust in its bonds. In the future, this the US would need to increase its bond yields in order to remain attractive to investors.
I was expecting businesses and consumers to decrease their spending (Consumer Confidence Index decreased to 71 from 85 last month), causing a dismal earnings season as company revenue would decline.
I was also expecting businesses and consumers to begin saving their money for a future debt ceiling and government furlough/budget crisis that will arise early next year when the federal government begins to get close to the new debt ceiling.
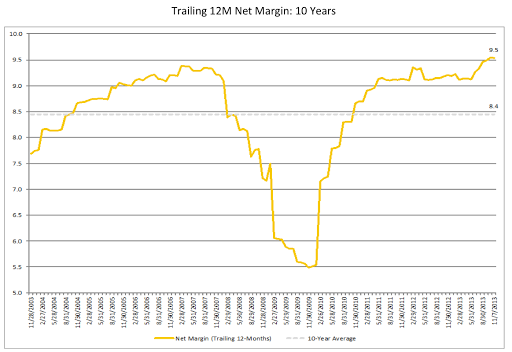
Stock Market Overvalued: The increase in stock prices for the past four years can only be attributed to an increase in spending because of artificially low interest rates, not actual economic growth.
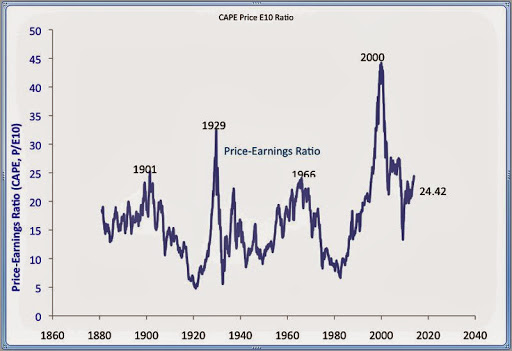
This chart of the Price to Earnings Ratio show stocks have are expensive relative to 10 year average earnings. The ratio, popularized by Robert Shiller, is about 24, which is much higher then the long-term average of 16. Looking at it’s history, this index is at it’s highest during recessions. The 1929 high is the same time as the stock market crash that caused the Great Depression. The highs in 1966 were caused by the Cold War/Vietnam fear, in which spending crashed because of fear of getting nuked. The 2000 high was preceded by the stock market crash, and was also high in 2008.
This chart created by the New York Stock Exchange compares the NYSE Margin Debt (money borrowed to pay for stocks) and the S&P 500 Growth shows that the gap is largest right before a recession. Right now, it’s at a 150% difference, around the same difference as it was in October of 2007, two months before the stock market crash.

Simple addition shows that 48% of companies have reported actual sales below estimated cells, which is lower then the average over the past four years (59% beat estimations).

Earnings growth percentages are at high rates, and can not be sustained for that long. Once the growth begins to slow down, investors begin selling because the company is becoming less profitable.
The Fiscal Cliff, An analysis of the situation
StandardNote: For this analysis, I had to rely on secondary sources for quantitative data on the American economy, because the primary sources, the US Government surveys and websites, are closed due to the government shut-down.
Background:
By now, everyone in America should know about the upcoming Fiscal Cliff. America’s government is spending $60 billion USD per day, and only raking in $30 billion per day from taxes and bonds. As a result, there is a $30 billion deficit per day. For the past 10 years, that deficit has been increasing steadily.
In 2011, the deficit reached the equivalent of America’s GDP (roughly $15 trillion). The debt ceiling at that time was America’s GDP. If America reached the debt ceiling, the government would default on all its payments. It would no longer be able to operate, or pay its hundreds of thousands of employees, or pay back bonds, or give out Social Security, Welfare, and Food Stamps. The only way to avoid defaulting on all the loans was to increase the debt ceiling, which Congress did at the very last minute. Because Congress waited until the last minute to increase the debt ceiling, investors panicked and the stock market tanked. The economy then went through a mini-recession, and America’s credit rating was downgraded.
How the deficit got to this point: America’s huge national deficit can be attributed to a variety of reasons. During the Bush administration, taxes and interest rates were decreased, while federal government spending increased to an all time high (nearly $1 billion per day spent just in Afghanistan/Iraq). Bush enacted those policies to encourage spending because the economy was still in a recession from the 2000 Financial Crisis. The Bush-era tax cuts lasted from 2003 to 2012, so for those 9 years, the government was getting more then 10% less in taxes then it got before the tax cuts. The Iraq war that began in 2001 and ended just last year required the federal government to spend nearly $1 billion per day to pay troops, and maintain equipment over seas. Bush also created a variety of new government programs which required a lot of federal funding, like the NSA, TSA, and the Department of Homeland security. During this time, America was spending a lot more then it was taking in from taxes. Obama is also responsible for some increase in the national deficit through his economic aid programs, and tax cuts for the poor.
Back to the present: America is expected to hit the new debt ceiling that was created in 2011 in the middle of October. Secretary of the Treasury Jack Lew expects the federal government to run out of money on October 17th, this Thursday. Similar to 2011, Congress knew that America was going to hit the debt ceiling months ago, but did not vote on any legislation to increase it, or decrease national spending. In addition to the debt ceiling crisis, Congress also has to deal with the Federal government shut down. The 2012-2013 Federal government Fiscal Year ended on September 31, 2013. The 2013-2014 Fiscal Year for the government started at 12AM on October 1st, 2013. But, Congress did not pass a 2013-2014 Fiscal Year Budget before the new Fiscal Year began, and still has not passed the new budget 14 days later. As a result, most Federal government programs are shut down, with the exception of defense/security, and Food Stamps/Welfare. For every week the Federal government is shut down, America’s GDP is supposed to decrease by 15 points, because the government is no longer able to pay its hundreds of thousands of employees, or pay for its various programs.
The Cause: The Affordable Health Care Act/ObamaCare is most widely attributed to the cause of the government shut down and the delay in increasing the debt ceiling. The Affordable Health Care Act attempts to make HealthCare available for all Americans, despite their wealth and pre-exsisting conditions. It also attempts to make HealthCare mandatory for everyone (that’s the only way a program this expensive can work) by fining those who do not sign up. The Act also imposes a higher tax on medical companies’ profits, and attempts to decrease the cost of medicine.
Republicans, who have a majority in the House of Representatives, do not want to pass the Affordable Health Care Act, because it charges the young, wealthy, and healthy more in order to compensate for the old, poor, and obese Americans. Republicans also believe that the Act is too expensive, and will raise the national deficit even more, which would cause an increase in taxes, which would damage the pace of America’s recovering economy. The Affordable Health Care Act upsets Republicans because it makes the government the primary medical insurer, instead of private health insurance companies that compete against each other (free market/competition). Republicans will only pass a bill/act if it contains clauses that explicitly stop funding for ObamaCare/the Affordable Health Care Act until next year, when they plan to debate it more.
Democrats, who have a majority in the Senate, support ObamaCare because it aligns with their principles of making health care available to everyone, especially the poor. Democrats refuse to pass any legislation that delays funding for ObamaCare.
Because financial bills/legislation must go through both the House of Representatives and Senate and get over 2/3rds vote, no legislation has been passed. The Federal Government’s 2013-2014 Fiscal Year Budget was not passed because neither parties were satisfied with the wording of the budget. The Republicans wanted postponement of ObamaCare, the Democrats refused and voted against it. The same situation is happening to the debt ceiling, Democrats will not pass a Republicans bill that calls for an increase in the debt ceiling, and a postponement of the Affordable Health Care Act, and the Republicans will not settle for the Democrat’s bill which calls for an increase in the debt ceiling, and no wording of postponement of the Act.
Bottom Line: America’s Federal Government has been furloughed for the past 14 days, and no increase in the debt ceiling legislation has been passed because neither political party is willing to cede to the other.
The vast consensus is that hitting the debt ceiling is going to cause a devastating result, one that will cause a recession that makes the 2008 recession look pale in contrast.
Radical Republicans: Some radical Republicans are okay with America hitting the debt ceiling.
Some of those Republicans are die hard in their principles and would rather see America go into economic chaos then cede to the Affordable Health Care Act, which they believe is a violation of their freedom, and should have been ruled unconstitutional by the Supreme Court.
Other Republicans realize that increasing the debt ceiling is just going to be causing problems later down the road, so we might as well hit the debt ceiling now, because we’re going to hit it eventually. Those Republicans are somewhat right in their theory. America will just keep on piling debt on top of debt, and eventually that debt pile-up will lead to doom. The increase in debt would also cause an increase in interest rates, because in order to sell its bonds, the American government needs to increase its bond yields so that the bonds still remain interesting to investors. The increased bond yields would also cause an increase in taxes, because the government cannot rely only upon bonds to pay off its interest on the bonds.
Other Republicans believe that the American government could cut back on its spending, without increasing the national debt ceiling. The government gets approximately $30 billion per day through taxes and bonds, so if the government were to reduce foreign aid, federal arts funding, grants, and release some of the federal work force, it could get its spending down to $30 billion or less per day. The government could also get rid of ObamaCare, the Federal Communications Commission, and the Department of Education, making state governments responsible for managing their own education.These Federal government decreases in spending will decrease the $60 billion the government currently spends daily to an amount almost equal to the $30 billion it takes in. This will slow down our rate of hitting the debt ceiling, and will manage to pay bills when we hit the debt ceiling and are no longer allowed to borrow money.
The Republican party has been trying to reduce the federal government’s spending for months now, and they feel that the debt ceiling is their only leverage against the Democrats to succeed in reducing Federal government spending.
Effects of hitting the debt ceiling: If America hits the debt ceiling on October 17th, the Federal government will need to decide how to prioritize its payments.
The government has an obligation to pay its workers, Seniors and Veterans Social Security, and the unemployed/poor Unemployment Benefits and Food Stamps. But, the government also has an obligation to pay off its current debt, which is in the form of interest on bonds. The government will not be able to do both, so it must decide which one to do. If it chooses to violate its first obligation (Social Security, pay, Food Stamps) it risks domestic uprising/anger, a decrease in GDP, and causing starvation to its poorest citizens. If the government fails to pay its interest on borrowed bonds, the government risks getting its debt rating downgraded, causing an increase in interest rates and bond yields, and economic chaos as investors pull out of the stock market.
If America’s debt rating is downgraded, investors will be less likely to invest in America’s government by buying bonds because America will be a risky investment, since it defaulted. Additionally, America’s bonds will have to have a higher yield because its bonds are a risky investment, and investors are more likely to invest in a risky investment if the rate of return matches the risk. This will cause an increase in America’s taxes, because the American government will need money to pay for its current expenses, and pay back its yields on borrowed bonds.
Even though we have not hit the fiscal cliff just yet, consumer confidence has wiped out the last two years’ gains. Consumers are worried about Congress’s constant bickering, and lack of ability to produce a bill/legislation that can be passed and will increase the debt ceiling. Investors right now are mixed, but they are preparing for the worst. For the past two weeks, the stock market has been decreasing, because of fear of the fiscal cliff. Recently (Friday and today), there have been more talks about a temporary increase in the debt ceiling, which caused investors to gain some confidence and re-invest in the markets.
Wharton Business School’s top negotiators came up with some humorous solutions to the crisis. One of the possible solutions was to have both sides visit 5th graders in a middle school, explain the problem to them in simple terms, and ask them for their solutions. Another possible solution was to have both sides write up their proposals, and submit them to Nelson Mandela, who would choose the fairest proposal.
Additional Questions: There is also the question of how long Congress should increase the debt ceiling for, and if there should be any wording about defunding ObamaCare. If Congress increases the debt ceiling for two months, a reasonable amount of time to change the country’s finances, the issue comes up during Christmas time, an awful time as Congress and the American people will be in Christmas/vacation mode. In addition, US Consumer spending is supposed to be at an all time high during the Christmas season. If the issue of the debt ceiling comes up in mid December, consumers will be worried about the future, and save their money, instead of spending it on Christmas/holiday gifts. As a result, companies will not get the revenue they need to post profits, lose investment from foreigners, and might fire workers in the beginning half of next year to reduce costs.
If Congress postpones the debt ceiling for 3 or 4 months, the issue comes up during the Federal Reserve’s tapering off the Quantitive Easing program. (Jan-March 2014). Investors will already be worried about the effects of increased interest rates on the markets, and if they have to deal with the fear of America hitting the debt ceiling, they might panic, and sell, causing a mini-recession.
If Congress postpones it any longer, Congress will basically forget about the issue, and will only start arguing about it a couple weeks before America is scheduled to hit the debt ceiling, just as they did in 2011 with the debt ceiling, 2012 with the tax increase, and now 2013 with the Fiscal Year Budget and the debt ceiling. However, if we push the debt ceiling up just enough to sustain the US Federal government’s spending for the next 7 months, the issue will come up right before Senate and House of Representative elections. I believe only then will the Congressmen actually come up with a good solution for the problem, otherwise they will not be voted back into office.
Hit the Debt Ceiling: The Republicans who believed that the US would survive if it hits the debt ceiling are right. The author of a Wharton Blog cites Harvard Professor Howell Jackson’s scenario where the US hits the debt ceiling, and has to prioritize its payments. Professor Jackson states that the federal government has “plenty of tax revenue to cover the interest” on the bond yields, with some left over to pay its other bills. Professor Jackson is arguing that the US government can prioritize its payments without borrowing money once it hits the debt ceiling. The government can prioritize paying off its interest on bonds with the tax revenue money, and use the left over money (there should be a decent amount) to pay other bills, like the salaries of its employees. Prioritizing paying off the interest will prevent America from defaulting, getting its credit rating downgraded, and the panic that comes after the world’s strongest economy is downgraded. The only problem with prioritizing the interest rate payments is that will take longer and longer to pay the employees, because they can only be paid a tiny bit every day, and most federal government programs will need to take a cut.
In other news, JP Morgan & Chase posted its first quarterly loss since CEO Jamie Dimon took over in 2005. JP Morgan, the biggest US bank by assets, posted its $380 million loss (compared to its $5.7 billion profit last year) due to rising legal expenses, and reduction in new mortgages. Dimon attributed the bank’s decrease in new mortgages as consumer wariness of the possibility of increased interest rates this year.
Federal Reserve Chairman Ben Bernanke was expected to decrease his aggressive Quantitive Easing Plan to $60 billion per month in September, but postponed it due to lack of economic growth. Bernanke, a dove, created the Federal Reserve’s Quantitive Easing Program involving the Fed Reserve buying $85 billion in US Treasuries and Bonds per month in order to lower interest rates, which would cause a decrease in the unemployment rate. If interest rates were low, consumers would be more likely to borrow money, and then spend the money. Businesses would benefit from the increase in consumer spending, and also borrow money to hire more workers, and invest in new products/services. Bernanke planned to taper off the QE Program in September because the unemployment rate was decreasing at a steady pace, and was at 7.3%. However, Bernanke noticed that the unemployment rate was not decreasing because businesses were hiring more, it was decreasing because the unemployed were giving up on finding jobs. As a result, Bernanke did not taper off the QE Program, and is expected to continue it until he retires from the Chair in January 2014. His successor, Janet Yellen, also a dove, is expected to continue the QE program until the unemployment rate reaches about 6.5%. The only problem with the QE program is that it encourages inflation, because consumers and businesses are now increasing the demand for money, while keeping the supply constant.
An up and coming issue is the number of baby boomers about to retire. Baby-boomers are considered as babies that were born post World War 2 (1940’s – 1960’s), because the economy was improving (Great Depression is over) and because everyone was just in a good mood to be back from a war that they won, and a war in which USA essentially saved the world. There are about 80 million of those baby boomers, and they are all about to retire. When they retire, many of them will begin using Social Security, Medicare, and getting their pensions. The federal government needs to begin saving up for those unprecedented expenses, even though the government is already laden with debt. Mark Duggan, a Wharton Business professor estimates that the number of Americans aged 65 and up will increase by 90% by 2030, while the number of Americans aged 18-64 (those who pay taxes) will only increase 10%. Another problem for the US government; the government owes more people money then it is getting. The US needs to begin planning for this now, and one of the best ways is by reducing the national deficit. This means cutbacks on spending. Duggan also suggests that the government change the way Social Security is measured by changing the pay average from 35 years to 40 years, which decreases benefits for them, and increases the number of years they work. Besides the baby-boomers needing Social Security and Medi-Care, many city and state government workers need Social Security payments from the federal government, because the states they worked at do not have the funds to them. A perfect example is Detroit, laden with hundreds of millions in government worker pensions. Michigan can not pay it off, and is requesting Federal government assistance, like many other states.
Month in Review/Current State of Economy
StandardHi Everyone,
I apologize for not having blogged in the past week, I had to spend all my time studying for the SATs. I’ll post an article in the next few days which will describe why I think the SAT is a bad idea.
Since we’re still in the first week of October, I feel it is necessary to blog about the Month-In-Review
Domestic/America:
As mentioned in previous posts, the American stock market is at an all time high. It is highly overvalued. When I say stock market, I am referring to the S&P 500, the Dow Jones Industrial Average, and the Nasdaq 100. The stock market has been climbing steadily for the past four years (since 2009, when it crashed), but in the past two years, the stock market really its pace of growth. In 2012, the stock market reached its pre-market crash levels (2008 levels), and so far this year, its growing at an incredulous double digit rate.
Interest Rates/Unemployment: Currently, Federal Reserve Chairman Ben Bernanke’s agressive Quantitive Easing Program continues at the same rate as it did when it first started a couple years ago. The aggressive QE plan calls for the Federal Reserve to purchase $85 billion in US Treasuries and Bonds per month in order to keep interest rates low. The low interest rates are supposed encourage consumers and businesses to borrow money by making it cheaper to borrow. Businesses would borrow money to expand their business by hiring new workers, and investing in new products/innovations. Consumers would borrow money and then spend money on products/services, fueling the economy.
Since the program was enacted a couple years ago, the unemployment rate has fallen by at least 0.1% per month. Although August’s and September’s unemployment numbers support the decrease, additional research shows that the decrease is simply because people have given up looking for jobs, not because they’ve become employed. This cancelled the Fed Reserve’s plans of beginning to taper off the QE program, because the economy did not recover to a satisfactory level. It is important that the Federal Reserve taper off the QE program soon because with low interest rates over a long period of time comes increases in the rate of inflation. The Fed Reserve plans to keep interest rates between 0% and 0.25%.
Next Federal Reserve Chairman
Janet Yellen, a dove, is scheduled to replace Ben Bernanke as Federal Reserve Chair(wo)man, when Larry Summers, a hawk, withdrew his name from the race early in September. A dove’s first priority is to keep unemployment rates low. As a dove, Yellen supports Bernanke’s aggressive Quantitive Easing program because it attempts to keep interest rates low. By keeping interest rates low, it becomes cheaper for businesses to borrow money and expand their business (by hiring more workers).
Summers, who was believed to be the successor of Bernanke before withdrawing his name, thought it best to repeal the aggressive Quantitive Easing program ASAP, because it would cause an increase in inflation rates. As a hawk, Summers first priority is to keep inflation rates low, which means that interest rates need to be increased. If it becomes really cheap to borrow money, more people will borrow money (more demand of money) while the supply stays constant, and then the money won’t buy as much. People will then borrow more money because of the low interest rates, fueling the cycle.
Stock Market: As mentioned before, stocks are at an all time high. Good news, right? Wrong. As stock prices rise, consumers want to invest their money into stocks, in order to get onto the profit wagon. As stock prices increase, consumers need to borrow money in order to buy stocks (margin trading), and gain profits. With the aggressive QE program and the resulting low interest rates, it is cheap to borrow money to buy the stocks. But, in a couple of months when the tapering begins, interest rates will rise, it will become more expensive to borrow stocks, and people will start selling. When the markets begin going down, everyone will rush to sell, especially those who are investing with money they don’t have (margin traders). As a result, the stock market will crash. Additionally, with low interest rates, consumers will spend less money, and if they spend less money, businesses earn less revenue. With less revenue, businesses no longer look profitable, and their stocks are sold. After businesses lose investment money, they begin firing people at the office in order to reduce costs. To read more, click here
In addition, the stock market’s growth is not because the companies are consistently beating earnings by extraordinary amounts.
Government Shutdown/Debt Ceiling: It is currently day 5 of the US Federal Government’s shut-down. The US Federal Government shut down at 12:00 AM on October 1st, 2013 because Congress could not approve on a budget for the 2013-2014 Fiscal Year. The government’s 2012-2013 Fiscal Year ended at 11:59PM on September 31st, and because Congress did not approve a 2013-2014 Fiscal Year Budget, the Federal government has no money to spend. Congress did not approve the Fiscal Budget because the Democratic controlled Senate would not pass a Fiscal Budget passed to it by the Republican controlled House of Representatives. The bill created by the Republicans calls for a postponement/defunding of ObamaCare for a year. The Democrats will not accept that, because they want ObamaCare to be passed now. ObamaCare was created to help make Health Insurance available to everyone through the federal government. Anyone can purchase ObamaCare for cheap, regardless of age, health, income, and pre-exsisting disease. Republicans believe that this plan is too expensive, especially for a nation already laden with debt, so they refuse to pass any legislation that does not postpone the discussion of ObamaCare for a year. I will post a blog discussing ObamaCare tomorrow.
One of the biggest problems caused by the federal government being shut down is the decrease in GDP. America’s GDP is supposed to decrease by 15 points for every week that the government is shut down because the federal government employs hundreds of thousands of workers, and if the government’s shut down, they will not be payed. If they’re not paid, they have no money to spend.
Debt Ceiling: On October 17th, 2013, the US Government reaches its debt ceiling. Congress now needs to pass legislation that will increase the government’s debt ceiling. I talk about why there is so much debt in a previous post. If the debt ceiling is not approved by Oct 17th, the US essentially defaults on all of its payments for the first time ever. If this happens, the entire international economy will spiral. The wealthiest nation in the world can no longer pay back its bonds (borrowed money), and can no longer lend money to consumers and banks. Couple that with increased interest rates, increased costs of food because of a lack of subsidies, increased taxes, and the hundreds of thousands to millions of unemployed US government employees, and the GDP of every nation will decrease.
If the US defaults and can no longer pay its payments, its credit rating goes down. The last time the US’s credit rating decreased was in 2008, and that resulted in a large recession with an unemployment rate at 12%. If the US Credit Rate decreases, investors will be less likely to invest in US Bonds, or would demand higher interest/yield rates to make up for its risky investment.
Pension Crisis: This was first reported with Detroit’s file for bankruptcy. Detroit owes hundreds of millions of dollars as pensions to government workers, and because Detroit is bankrupt, it requires federal government assistance/funds to pay the pensions. Although Detroit is one of the only US cities to go bankrupt, the pension crisis is happening to other cities too. More and more cities are requiring federal funds in order to help give pensions to the retired government employees. The baby boomers (huge number of babies born in the 1940s as a result of post-World War II activities) are at that age when it is time to retire (60’s). Those baby boomers are going to need Social Security cash/checks. The federal government now needs to find a way to allocate more money to be used to pay off promised pensions and social security. This will increase the national debt, and cause an increase in taxes.
International:
The international economy as a whole is improving. The BRIC countries, Brazil, Russia, China, and India, a term coined by Goldman’s top economist Jim O’Neill in the early 2000’s as the countries most likely to grow this year, are still growing, but their growth is beginning to slow down. Brazil is scheduled to have the World Cup Soccer tournament next year, so its economy will boom in the upcoming months, but currently, its economic growth has been slowing down more then analysts predicted. China’s economy is also slowing down in terms of growth. The same for India, but India is also facing currency inflation. Over the summer, the Indian Rupee reached its lowest point ever, 70 Rupees bought 1 USD, and more then 100 bought a British Pound. As a result, it became more expensive for Indians to go abroad, both to vacation and to study.
China, India, and Brazil’s economies are slowing down because of all the investment that has already occurred. The costs of living/having businesses in those countries has increased ten-fold. Property values, food, and labor costs have sky-rocketed. Governments are attempting to increase foreign investment taxes in order to benefit themselves (corruption) and help their own economy. In addition, America’s economy is offering a higher rate of return then foreign investments.
I address India’s faltering economy in a previous post, but the general idea is that the government is printing too much money causing inflation and not spending enough money. India’s property values have sky-rocketed because of so much foreign investment. The population of its cities has also increased exponentially; cities that were meant for hundreds of thousands of people now have millions of residents. The infrastructure can not handle those many people. The government has allocated/planned hundreds of billions of rupees (crores) to be be spent on improving internal vital infrastructure, but only a couple projects actually go through, due to high levels of government corruption.
Federal Government Shuts Down
StandardThis is just a quick update. It’s currently 12:10AM on Oct 1st, 2013, and the Senate has rejected the House of Representative’s amendment.


BusinessInsider first reported that this is the first time in 17 years that the Federal Government of the United States of America has shut down.
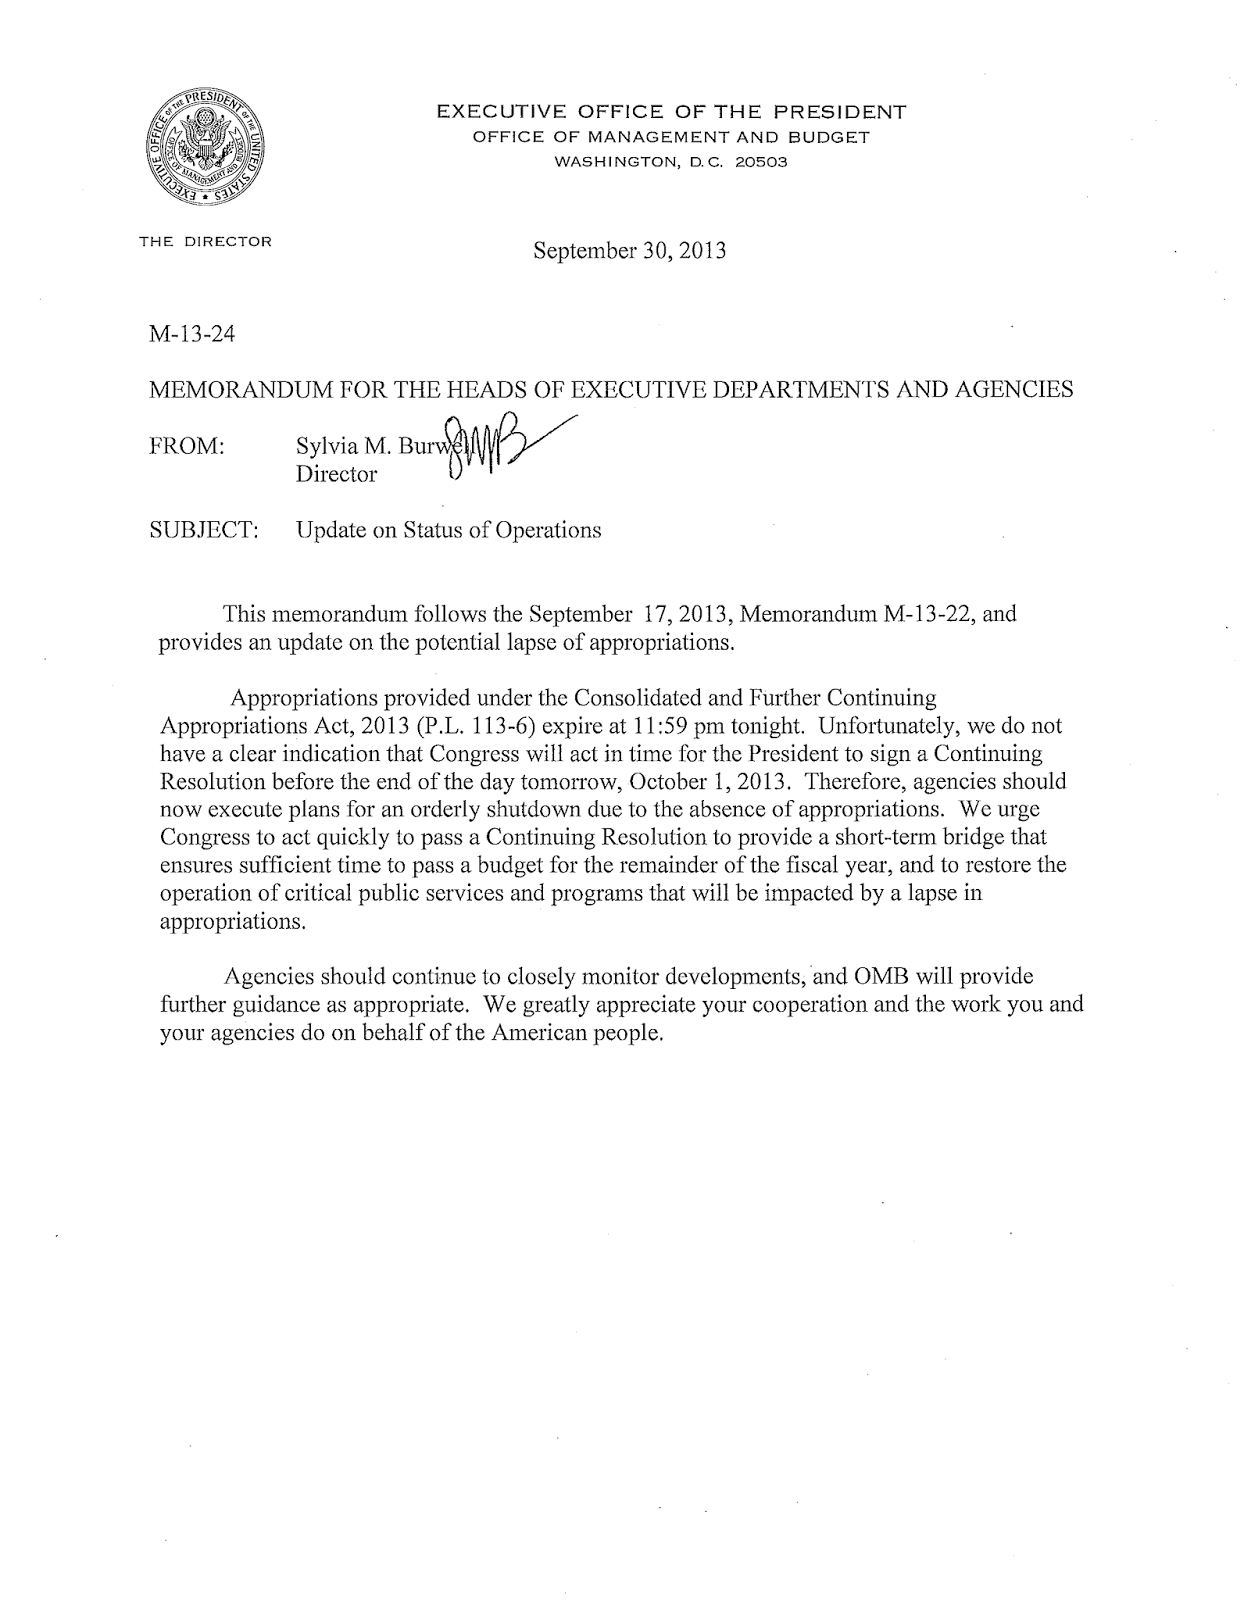
So far, I haven’t heard any bombs exploding, or seen any rioting in the streets, and I still have Internet and power, which leads me to conclude that the effects of the federal government shut down are not felt immediately, not too big of a deal.
The Brief: I12:01 AM on Oct 1, 2013 (today) marks the beginning of the Federal Government’s 2013-2014 Fiscal Year. Congress has not approved any Fiscal Plan for 2013-2014, so the Federal government does not have any money or right to pay for any nonessential items. Food stamps, unemployment, and military spending continues because those are considered essential. Unfortunately, public schools continue too, because the majority of public school funding comes from the state and local governments.
Congress did not pass a Fiscal Plan because of the fierce Republican and Democratic opposition. The Republicans control the House of Representatives, and want a Fiscal Plan that delays the enactment of, or defunds ObamaCare. The GOP believes that ObamaCare is too expensive; ObamaCare wants to make health care available for all Americans, regardless of wealth, prior illnesses, and health. America is already in debt ($16.8 trillion USD), and the economy is still recovering, so the GOP feels that this is a bad move. However, the Senate, controlled by the Democrats feel that ObamaCare is the right bill, and necessary, so the Senate vetoed any House bill/amendment that proposes to delay funding for ObamaCare. As a result, the new Fiscal Year began, and no bill or resolution was passed.
